Accessing the forecast
Go to Finance in the sidebar and click Budget Forecast. The table loads all participants with active plans.Reading the forecast table
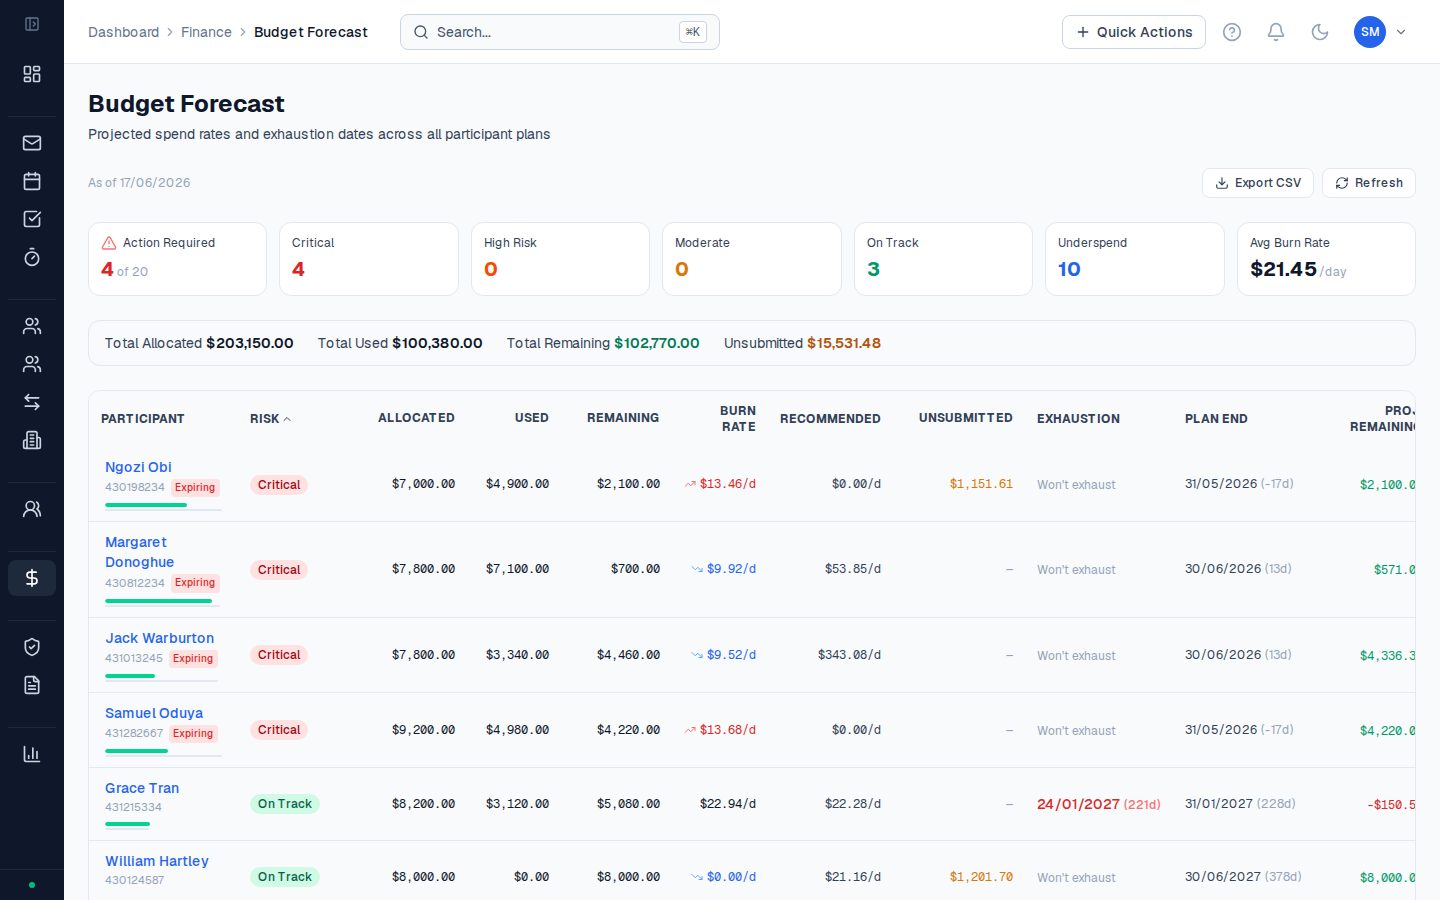
Each row is a participant. The columns show:| Column | What it means |
|---|---|
| Participant | Name, NDIS number, and risk/status badges |
| Plan period | Start and end dates of the current active plan |
| Allocated | Total plan funding across all support categories |
| Approved | Approved but not yet invoiced |
| Invoiced | Included in sent invoices |
| Unsubmitted | Approved activities not yet in an invoice |
| Submitted | NDIA claims lodged |
| Remaining | Budget left to spend |
| Burn rate | Weekly average spend weighted by allocation across budget categories |
| Health | Colour-coded plan health status |
Sorting and filtering
Click any column header to sort the table. This is useful for:- Sorting by Remaining to find participants close to running out of funds
- Sorting by Health to bring critical plans to the top
- Sorting by Plan period end date to find plans expiring soon
Exporting
Click Export CSV to download the full table. The CSV includes all columns plus NDIS number and plan end date — useful for reporting to your management or checking against NDIA portal data.The PACE footnote (†)
If your organisation has a mix of PACE and standard participants, you may see a † footnote on the table. This indicates that PACE funding period data is included alongside standard plan data — useful context when interpreting burn rates, since PACE periods may have different lengths than the standard 12-month plan cycle.Participants not shown
A note at the bottom of the table shows a count of participants excluded from the forecast because they don’t have an active plan with budget allocations set up in CoordHub. Resolve this by adding their plan under the participant’s Plans tab.Worked example
Participant: Jemma has a 12-month NDIS plan running from 01/07/2025 to 30/06/2026.- Category 07 (Support Coordination): $8,000
- Category 15 (Improved Daily Living — OT): $5,000
- Category 07: 2,800 Remaining. 65% used with 46% of plan period remaining.
- Category 15: 3,800 Remaining. 24% used with 46% remaining.
- Category 07 needs to be managed down — perhaps fewer activities per month, or a discussion about whether a plan review is warranted.
- Category 15 has significant underspend risk — worth discussing with the participant and their OT provider to increase sessions if the participant needs more support.
The forecast table updates every time you load the page. For a formal month-end review, use Export CSV to save a timestamped snapshot.